How do we go about predicting a linear system? Lets look at the example of a billiards game
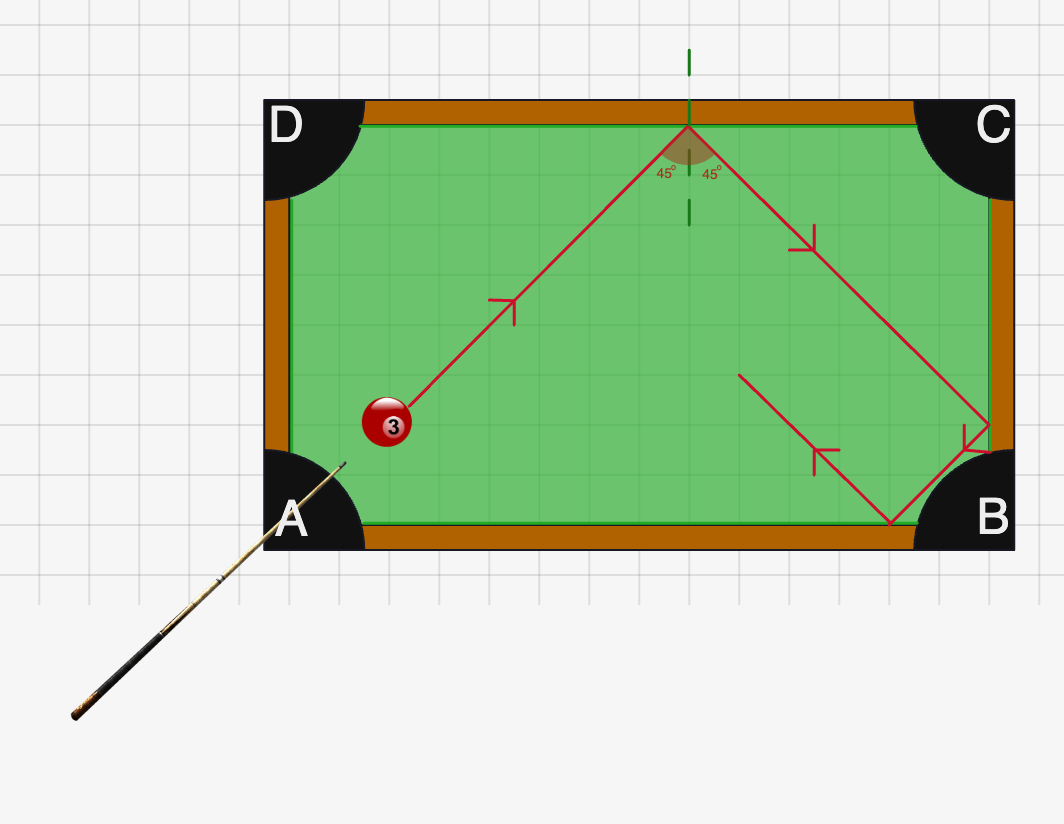
This is a good example of a linear chaotic system, as difference accumulates over time given any set amount of divergences from you estimation. In essence, a small difference in what you do vs what actually happens will lead to a large difference in the end result.
For the pool game, this linear system can be expressed mathematically as:
Where is a transformation matrix that describes how the balls move on the table. When the edge of the table is hit, the balls bounce off in a predictable manner, which can be described by the matrix .
Edward Lorenz (1917 - 2008)
Chaos: When the present determines the future, but the approximate present does not approximately determine the future:

Forecasting
Forecasting in linear systems can be done by iteratively applying the transformation matrix to the initial state . However, due to the chaotic nature of the system, small errors in the initial conditions can lead to large deviations in the forecasted state over time.
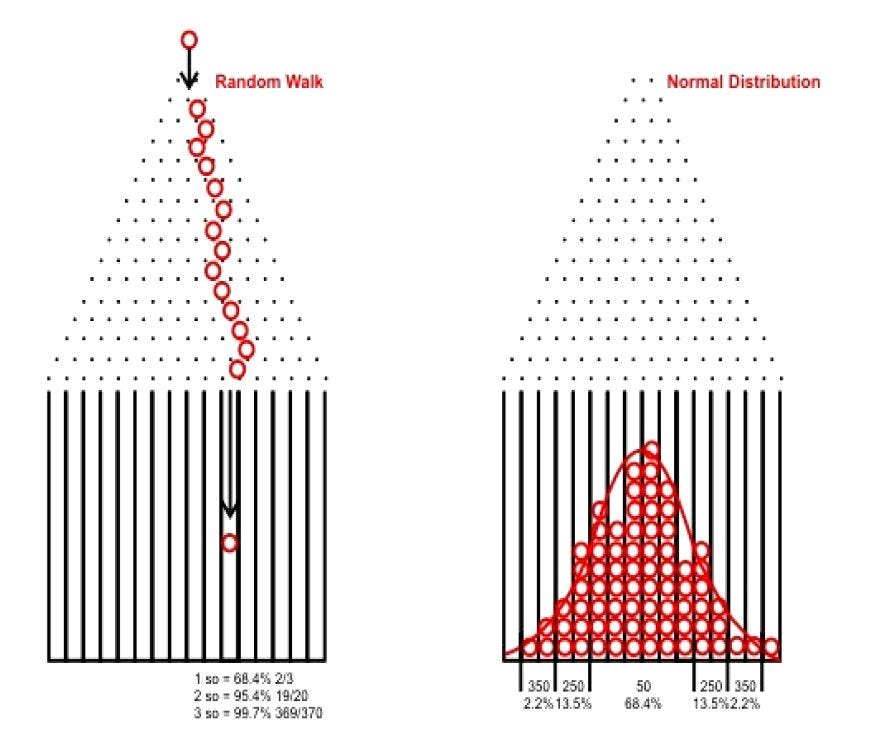
For a game like plinko, if we drop a ball from the top, we can predict its path by applying the transformation matrix at each level of the plinko board. However this gets so complicated that it is often easier to operate over the statistical distribution of outcomes rather than trying to predict the exact path of the ball.
Solutions
(Data Assimilation vs Ensemble Forecasting)
We have two main approaches to dealing with the uncertainty in linear chaotic systems:
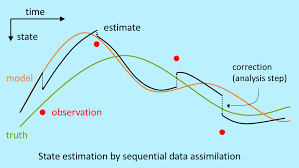
Data Assimilation
Data Assimilation involves continuously updating our forecast based on new observations. As we receive new data about the state of the system, we can adjust our predictions to better align with the observed reality. This method helps to correct for errors that accumulate over time due to the chaotic nature of the system.
It reminds me of the Kalman Filter approach used in control systems and robotics, where predictions are updated based on sensor measurements to improve accuracy.
Ensemble Forecasting
This involves running multiple simulations of the system with slightly varied initial conditions. By analyzing the spread of outcomes from these simulations, we can gain insights into the range of possible future states of the system. This method helps to capture the inherent uncertainty in chaotic systems.

Mathematical Formulation
Define to be the result of applying the function to the initial state a total of times.
Given an initial condition (IC) , we would like to characterize the system for large . Think of the .
The Logistic Growth Function
Oftentimes takes the form:
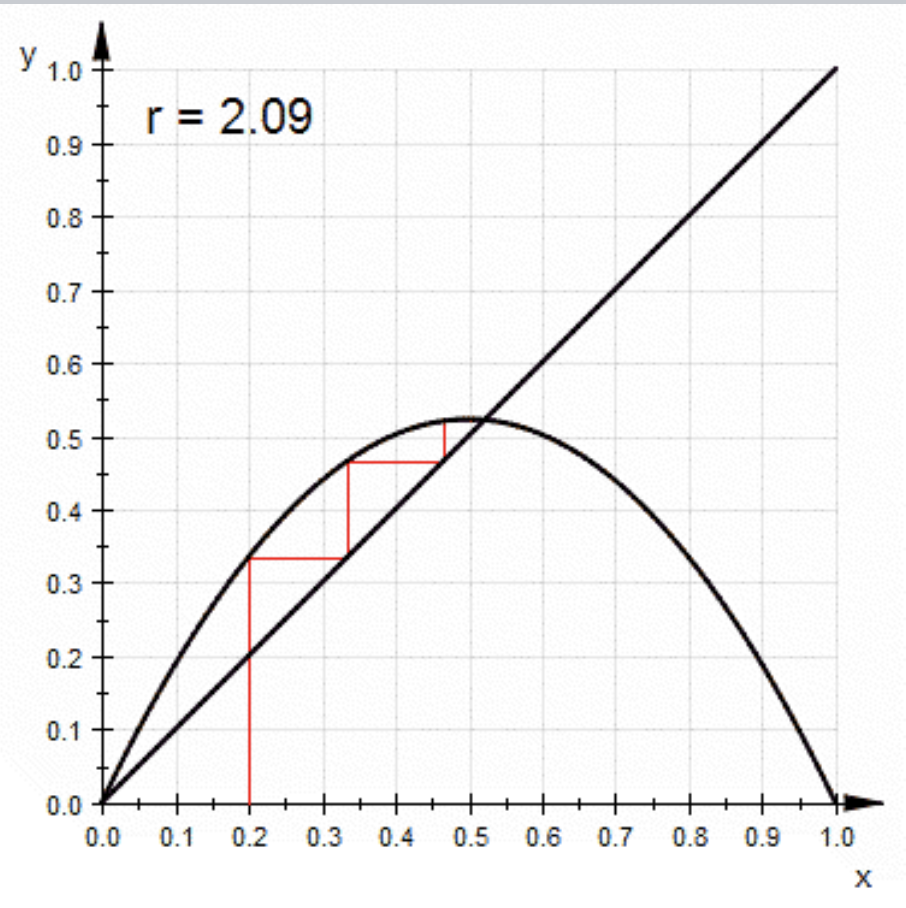
A is a parameter, so letting , given an initial condition , what is its long term outcome? Let . Its long term shape looks like the desmos graph below.
This is just the function for the porabola itself, but the interesting part is when we start iterating the function, meaning we take the output of the function and plug it back into itself repeatedly. This becomes:
Desmos
We can also solve this analytically, for example after we have assumed we can find by:
This would take quite a while though, so oftentimes we use computers to solve this. This is called iterating the map.
The Interesting Thing
You might notice for the graph above, the maximum extrema seems to lie on the coordinates . The fundamental idea behind a Logistic Map is that the maximum extrema is a fixed point, meaning that if we start at that point, we will always end up there. In other words:
By taking discrete approximation steps, we notice this “staircase” pattern emerging, where we can see how the function iterates towards the fixed point. You will also notice that if we plot the line , the points where the function intersects this line are the fixed points of the system.