Abstract
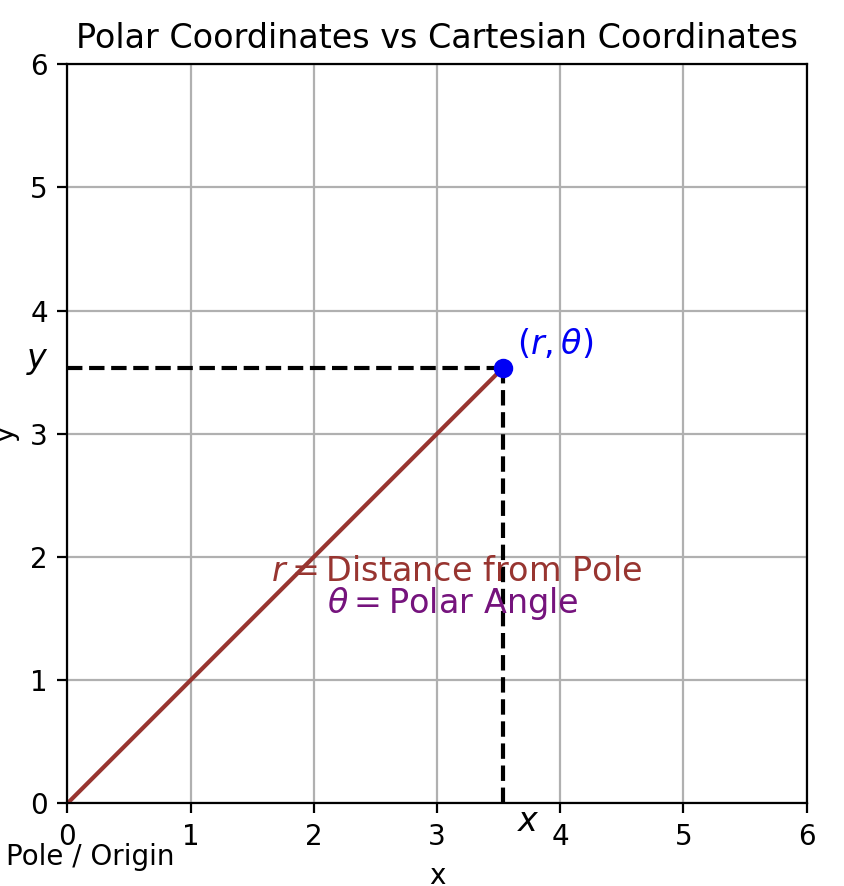
This script demonstrates polar and Cartesian coordinates, annotating both the radial distance r, angle θ, and the Cartesian projection on the x-y plane.
Image
Code
import micropip
await micropip.install("matplotlib")
await micropip.install("numpy")

import matplotlib.pyplot as plt
import numpy as np

# Values for demonstration (r = distance, theta = angle in radians)
r = 5  # radial distance
theta = np.pi / 4  # 45 degrees

# Convert from polar to cartesian coordinates
x = r * np.cos(theta)
y = r * np.sin(theta)

# Create figure and axis
fig, ax = plt.subplots()

# Plot the line representing (r, theta)
ax.plot([0, x], [0, y], 'brown', label=r'$\theta$ line')
ax.plot([x, x], [0, y], 'k--')  # dashed line representing height (y)
ax.plot([0, x], [y, y], 'k--')  # optional horizontal line for x

# Plot the point at (r, theta)
ax.plot(x, y, 'bo')  # blue point at the end

# Annotations for polar coordinates (r, θ)
ax.annotate(r'$r = \mathrm{Distance\ from\ Pole}$', xy=(x / 2, y / 2), xytext=(-5, 1.5),
            textcoords='offset points', fontsize=12, color='brown')
ax.annotate(r'$\theta = \mathrm{Polar\ Angle}$', xy=(x / 2, y / 2), xytext=(15, -10),
            textcoords='offset points', fontsize=12, color='purple')

# Annotations for Cartesian coordinates (x, y)
ax.annotate(r'$(r, \theta)$', xy=(x, y), xytext=(5, 5),
            textcoords='offset points', fontsize=12, color='blue')
ax.annotate(r'$x$', xy=(x, 0), xytext=(5, -10), textcoords='offset points', fontsize=12)
ax.annotate(r'$y$', xy=(0, y), xytext=(-15, 0), textcoords='offset points', fontsize=12)

# Set axis limits and labels
ax.set_xlim(0, r + 1)
ax.set_ylim(0, r + 1)
ax.set_aspect('equal', 'box')

# Axes labels
ax.set_xlabel('x')
ax.set_ylabel('y')

# Add the origin label
ax.text(-0.5, -0.5, 'Pole / Origin', fontsize=10)

# Show the grid and plot
ax.grid(True)
plt.title('Polar Coordinates vs Cartesian Coordinates')
plt.show()