This continues from the previous lecture on the subject
Lab Experiment
Example
You design an experiment to assess the hypothesis that the proximity of a snakc food affects individuals food preferences. Participants are bought inot a kitchen like setting, seated at a table, told to help themselves to the food, and left alone for 5 minutes. For half of the participants there is a bowl of apple slices on the table and a bowl of popcorn farther away on the counter. For the other half, the popcorn is on the table and the apples on the counter.
Question
What would be an appropriate control group?
Answer
An appropriate control group would be a group where both food options are placed at an equal distance from the participants, ensuring that proximity does not influence their food preferences. This way, any differences in food choice can be attributed to the food itself rather than its location.
The essence of this question is that the important factor is that the food is the same distance away from the participants, regardless of where the foods are. The important factor is that the food is equally accessible. However, we dont want to add an extra variable, so we dont want to add a third food option.
Gluten Experiment
Recall from the previous gluten experiment our hypothesis and prediction:
Hypothesis Flour used to make gluten-free breads lack molecules that can form structures similar to gluten proteins
Prediction Addition of molecules that can form structures similar too gluten will improve the quality of gluten-free breads
An appropriate experiment to test this idea would be to have four different breads: gluten-free bread with no additions, gluten-free bread with the addition of molecule A, gluten-free bread with the addition of molecule B, and regular wheat bread. The independent variable is the type of bread, and the dependent variable is the quality of the bread.
Question
What kind of data and tests would you conduct to evaluate the effectiveness of a gluten alternative?
Answer
Recall from the Gluten note that the 2 interesting properties that make gluten unique is its elasticity and viscocity. Because of this, we would want to measure these properties in the different breads. We could do this by measuring how much the bread stretches when pulled (elasticity) and how it flows when subjected to stress (viscosity). We could also measure other properties such as texture, taste, and overall quality through sensory evaluation.
Results
Wheat bread and gluten-free bread with HPMC have larger specific loaf volumes than gluten-free control bread.
Gluten-free bread with xanthan gum has a smaller specific loaf volume than the gluten-free control bread.
Key Point
Statistically significant differences may not be meaningful differences (i.e. will this difference in specific loaf volumes be noticeable to consumers?)
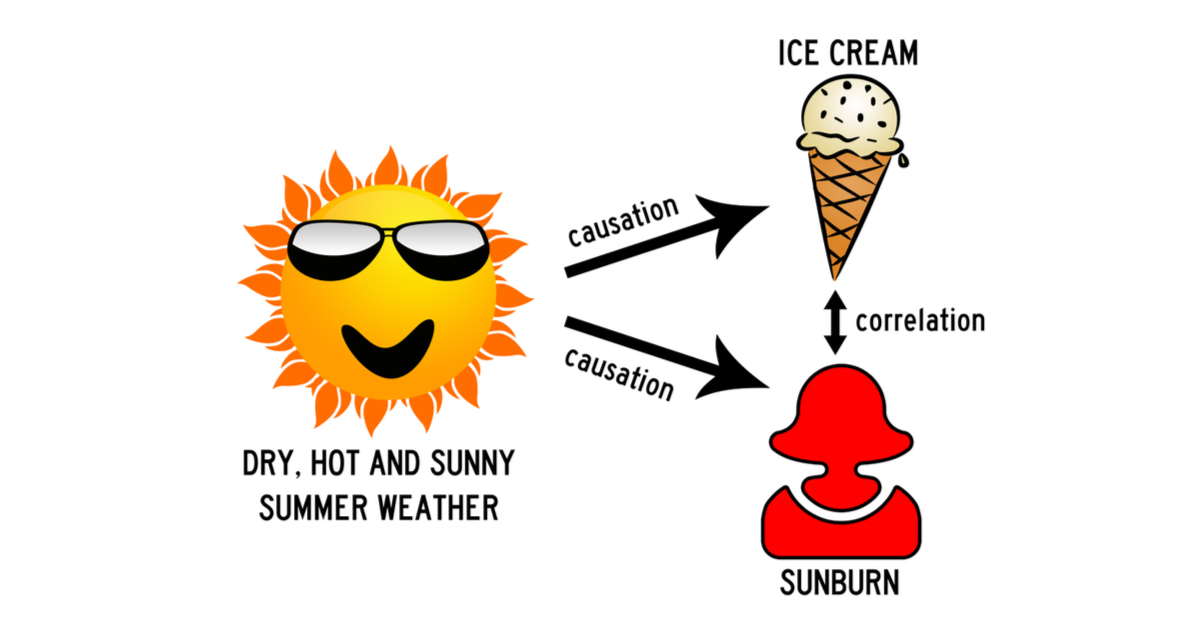
Correlation Vs Causation
This is a classic problem in science. Just because two things are correlated does not mean that one causes the other. For example, there is a correlation between ice cream sales and drowning incidents. However, this does not mean that ice cream sales cause drowning incidents. The real cause is the hot weather, which leads to both increased ice cream sales and increased swimming activities.
Correlation is a statistical measure that describes the extent to which two variables change together. A positive correlation means that as one variable increases, the other also increases. A negative correlation means that as one variable increases, the other decreases.
Causation means that one event is the result of the occurrence of the other event; there is a cause-and-effect relationship between the two events.